Dog and cats populations in Australia – 2018 and on …

Getting accurate dog population statistics in Australia is hard, really hard and there are good reasons for that.
However, with enough previous data, we have made some good estimates for JUNE 2018 values!
In June 2018 the domestic dog and cat populations in Australia are estimated to be:
- Dogs = 5 Million
- Cats = 4 Million
- Humans (potential owners) = 20 Million Ref 1
Good news for dogs.
After a decade of decline (2000 to 2010), it appears that dog numbers AND dog ownership (dogs per 100 People) are on the rise again. And the same is occurring for cats.
Domestic Dog Populations in Australia (the facts)
The first reason that dog population values are hard to obtain is that they either rely on dog registrations (which are a fraction of real-world dog populations) or surveys of human populations which only sample a tiny percentage of the human population and extrapolate.
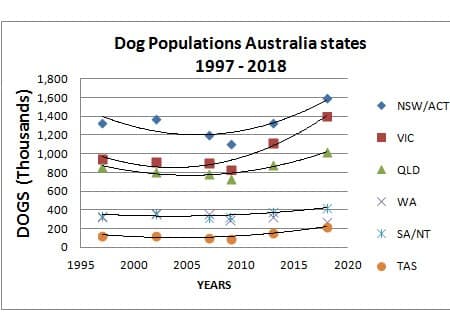
The major issue is that there are very few longitudinal studies done – ones completed by the same company, with the same test methods over several years – so there is little uniformity in data collection. That said the data that we were able to collect and extrapolate does show some very interesting trends. That said a reliable 2016 report put the total Australian dog population at 4.8 Million, so our forecast for June 2018 is right on track for that:
Dog Populations in Australia June 2018 (est)
| 1997 | 2002 | 2007 | 2009 | 2013 | 2018 | |
| NSW/ACT | 1,338 | 1,381 | 1,209 | 1115 | 1,329 | 1,596 |
| VIC | 949 | 913 | 906 | 836 | 1,122 | 1,402 |
| QLD | 860 | 815 | 794 | 732 | 884 | 1,018 |
| WA | 324 | 367 | 357 | 296 | 333 | 278 |
| SA/NT | 341 | 367 | 321 | 329 | 384 | 423 |
| TAS | 127 | 129 | 105 | 97 | 163 | 222 |
| Total | 3,939 | 3,972 | 3,692 | 3405 | 4,215 | 4,939 |
References – see appendix
A note about the data
As you can see we have used a parabolic trend line to estimate the June 2018 values. We were concerned about how high the 2013 estimates for dogs in Australia were (4.2 Million) until we looked at various 2016 Australia total dog populations that by the AMA article (ref 2). It put the 2016 total dog populations at 4.8 Million dogs. So if the last two dog population estimates (2013 and 2016) are reliable then using a parabolic trend line to get a total dog population of 4.9 Million for June 2018 is very much on track, maybe even an underestimate.
So why the up-surge in dog ownership in Australia?
Who is the typical Australian pet Owner ?
Ref 2 – Percentage of each segment who currently own a pet (2016 data)
| PET OWNER (more likely to be) | NON PET OWNER (more likely to be) |
| 64% Female | 44% Male |
| 72% Generation Y (18-29 yrs)
64% Generation X, 30-49 Yrs) |
45% “silent Generation” 70 yrs plus |
| 66% Working part time
65% working full time 68% Earning Middle to higher incomes ($70k-100K) |
46% Not currently working
45% Living in households with an income of less than $30K |
| 68% Living in a freestanding home
65% Homeowners |
59% Living in apartments
49% Living in a townhouse 44% Renters |
| 74% Living in larger households i.e. living
in a household with three or more adults 73% living in a household with children 72% Living in a de-facto relationship |
52% Living alone
49% Living in households where there is only one adult 48% Separated, divorced or widowed 42% Living in households |
| 64% From an English-speaking background | 49% From a non-English-speaking
backgrounds |
Base: 2016: Total sample, n=2, 022; Q: Thinking now about pets. Which of these pets, if any, do you have in your household? Note: Reptiles include snakes, turtles/tortoises, lizards and frogs/salamanders. Small mammals include rabbits, guinea pigs, ferrets and mice/rats.
The state of the dog industry in Australia
There have been many reports on the dog industry in the last few years, how people are treating their dogs like fur-babies (humanising them) and spending much on premium food, grooming and other services. However costs such as vet visits, pet insurance etc have sky-rocketed in the last few years.
This combined with the psychographics including income levels of the typical dog owner in Australia confirm that dogs are becoming an item that can only be afforded by the more dedicated or well heeled individuals. These two dog statistic tables confirm this information.
IN particular you will see that between 1997 and 2007 that dog populations recorded a reduction in each measured year after 1997 (ie a drop in 2002 and then 2007). Back then, this put the dog industry in a spin. What if dogs were falling out of favour?
Bis Shrapnel did the dog population measurements for 2007 and 2009 and we were still seeing a reduction in dog populations. But this was a time of the Global Financial Crisis. Just security and general income were in great doubt across the country, so that partially explains the continual decline in dog ownership numbers.
Australian Dog ownership per 100 People (1994 to 2018)
| 1994 | 1998 | 2002 | 2005 | 2007 | 2009 | 2018 | |
| Dog Popn (mil) | 3.78 | 4 | 3.97 | 3.75 | 3.69 | 3.41 | 4.9 |
| Dogs per 100 people | N/A | 20 | 20 | 18 | 18 | 16 | 20 |
(Reference Biz Shrapnel) + our 2018 forecast
It is the above table that puts the dog population and dog ownership statistics into clearer focus.
While dog populations were relatively stable during 1994 to 2009, the human population was growing much faster, so the “dog ownership per 100 people” values were dropping fast.
The great news for dogs, is that June 2018 is the first year since 2002 that “dogs per 100 People” in Australia are back to the magical “20” numbers. A dog population of 4.9 Million and Human population of 25 Million means that dogs are again as popular as ever !
Why Australian dog populations decreased between 1995 and 2009
Dogs have always been Australians favourite big pet. Their cleverness, loyalty and companionship surpasses many human to human relationships. This dip in dog ownership was more caused by the rise of the internet and online entertainment devices taking up the time and interest of the human population during this time.
As electronic devices started moving from the workplace and task driven to entertainment devices for consumers, people found themselves with less time for things like dogs. If you have ever walked a dog regularly you will know how much time and other resources they can consume.
Australian Dog populations post 2009.
The first smart phones began mid 2000’s and 2007 marked a major uptake in these devices with the first iphone release. But by 2011 most of the negative consumer sentiment to do with the economy (GFC crisis) had passed. The increase in smart and powerful online entertainment devices had weeded out the pretenders in dog ownership by 2011.
The smaller pool of dog owners (percentage wise) were the people more serious about their dog’s health and ‘lifestyle’. This smaller group were ready to spend more money on premium pet food, mobile groomers and dog bling (coats, collars and accessories).
The other major cause of capping the dog population is the urbanisation of our population and the cost of housing. Smaller backyards and apartment living in particular reduces the practicality of owning a dog.
How many cats in Australia? (the facts)
 Cat population values in Australia are even harder to confirm than dog populations, as cats often take less maintenance, don’t need walks can live outside or anywhere in the neighbourhood. So its much more likely that cats are not registered with councils. Thus cat population values rely much more heavily on or surveys.
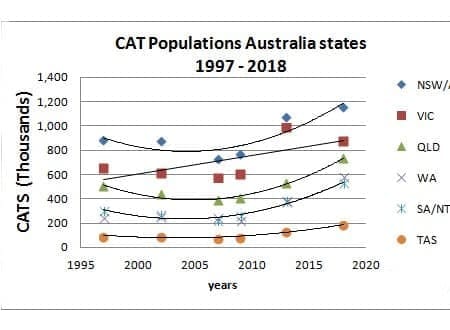
The latest total cat population figure by the AMA pet ownership survey 2016 put the cat population at 3.8 Million. We consider this to be on the high side. If you look at the four recorded cat populations from 1997 to 2009 you will see that there was a steady decrease in numbers! And the total Australian cat population in 2009 was only 2.3 million.
The 2013 cat numbers for NSW and VIC we so much higher than the 2009 population numbers it is believed that the different methodologies of data collection has the 2013 over estimate values ( at least compared to all previous years measured).
We used parabolic trend-lines for all states (to account for the higher 2013 numbers) except for VIC where this forecast would have been a very high outlier. With this methodology the June 2018 cat population (domestic owned) is estimated at 4.0 Million.

| States | 1997 | 2002 | 2007 | 2009 | 2013 | 2018 |
| NSW/ACT | 883 | 876 | 730 | 765 | 1,073 | 1,151 |
| VIC | 656 | 616 | 581 | 609 | 993 | 880 |
| QLD | 502 | 436 | 386 | 404 | 533 | 731 |
| WA | 249 | 256 | 251 | 227 | 381 | 583 |
| SA/NT | 303 | 266 | 217 | 263 | 384 | 527 |
| TAS | 95 | 95 | 78 | 82 | 131 | 186 |
| Total | 2,688 | 2,545 | 2,243 | 2350 | 3494 | 4,059 |
Australian CAT ownership per 100 People (1994 to 2018) *
| 1994 | 1998 | 2002 | 2005 | 2007 | 2009 | 2018 | |
| CAT Popn (mil) | 2.93 | 2.60 | 2.47 | 2.43 | 2.24 | 2.35 | 4.0 |
| CATS per 100 people | N/A | 14 | 13 | 12 | 11 | 11 | 16 |
*BisShrapnel 2010 report (PLUS OUR JUNE 2018 EST)
As you can see the cat ownership value (cats per 100 People) is at an all time high since before 1994 !
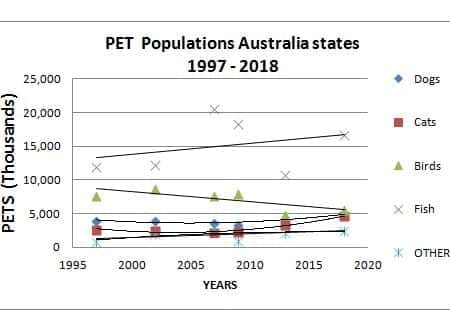
TOTAL AUSTRALIAN PET POPULATION 1997 to 2018

TOTAL AUSTRALIAN PET POPULATION 1997 to 2018
Numbers of pets is in ‘Thousands’
| 1997 | 2002 | 2007 | 2009 | 2013 | 2018 | |
| Dogs | 3,939 | 3,970 | 3,692 | 3405 | 4,168 | 4,939 |
| Cats | 2,688 | 2,470 | 2,243 | 2350 | 3,315 | 4,624 |
| Birds | 7,730 | 8,700 | 7,800 | 8100 | 4,915 | 5,616 |
| Fish | 11,900 | 12,200 | 20,500 | 18397 | 10,811 | 16,757 |
| OTHER | 800 | 2,100 | 2,875 | 1060 | 2,123 | 2,503 |
| Total | 27,057 | 29,440 | 37,110 | 33,312 | 25,332 | 34,440 |
Data – 2002, 2007, 2009 BisShrapnel Pet reports. 1997 = animals Australia organisation. 2013 = Galaxy Research
The totals in the above table vary slightly for Dogs and Cats from the previous analysis because we used trend lines on Totals (not individual states) and substituted the 2002 BisShrapnel data here for uniformity.
You will notice that there is some stability in figures for dogs and cats, as the registration process is more formalised. The birds and Fish data is very volatile due to lack of formalised data collection methods within those industries.
The AMA report for 2016 is probably as relevant as ever: ” While fish and bird numbers might have fallen, there were increases in the populations of dogs and cats over the same period. Dog numbers went up to 4.8 million in 2016 (a lift of just under 3% in three years) and cat numbers increased to almost 3.8 million (up 6%). Note that, while the pet populations may have shifted, household penetration of pets has remained stable overall (63% in 2013 versus 62% in 2016). This is most likely due to a 6% growth in the number of Australian households between 2013 and 20165. The only individual pet type for which a drop in penetration rates was recorded was pet fish (down from 15% to 12%).” Ref 2
CONCLUSION
While the major health benefits (physical and mental) of owning a dog are well documented. Depriving dogs of off lead time with their kind to satisfy their strong pack needs, substantially reduces the quality of life of many dogs in urban environments with time poor owners.
However with relatively good employment figures in Australia in early 2018 and the online entertainment (and smart-phone usage) participation reaching maximum penetration, people are now often going back to the basics of owing a dog. And with many dog owners being women (see table above) – they are acutely aware of the great mental and physical benefits of owning dogs for themselves and their families.
Cats are often a lot lower maintenance, but allergy issues, and cat ‘personality’ issues mean that many cats can take just as much time in the house to get along with as any dogs. Although for health aspects most cats do not require the level of exercise, particularly off lead parks, that dogs require.
All other pets such as birds, lizards and fish are generally much smaller in size, and cost much less to own and maintain over a year. These smaller pets provide a measure of human pleasure and connection but have nowhere near the connection and sentient characteristics of the dogs and cats for most people.
Employment types (full time, part time, unemployed), accommodation levels, still play a prominent role in the ability for people to own and adequately look after larger pets such as dogs and cats.
It is curious that large pet indexes are not included in major longitudinal studies of human happiness and prosperity.
References
Ref 1 = http://www.abs.gov.au/AUSSTATS
Ref 2 = Ama Pet ownership in Australian 2016 report
(2011-2016) of 1,870,800. During this five-year period, the population grew by 8.4%. So annual growth rate = 1.68%
The preliminary estimated resident population (ERP) of Australia at 30 June 2017was 24,598,900 people.
PET POPLULATON DATA
1997 = animals australia. org
2002 = pet net .com.au
2007 & 2009 = BIS Shrapnel
2013 = Galaxy Research, 2013
2016 = AMA Pet Ownership in Australia 2016 (pdf)

